 Written By:
Shashank Gupta
Written By:
Shashank Gupta

Introduction
Business teams today move fast, and they’re armed with more market and competitive intelligence data than ever before.
Yet turning this data into rich visualizations still takes a painfully long time, often limiting one’s ability to quickly identify meaningful patterns and emerging trends.
When you need to know:
- “What industries are being focused on by competitors for business expansion?”
- “Which regions are competitors hiring in?”
- “Which companies are trending in my target industries?”
These questions demand data visualization, but constructing them typically takes hours, especially when dealing with unstructured data such as news, press releases, blogs, case studies, job postings, etc. By the time decks are ready for strategic conversations, the window for timely action may have already closed. Eventually, your team is left reacting instead of leading.
But that changes now.
Introducing One-Click Trend Analysis
Contify One-Click Trend Analysis helps you quickly surface macro-level trend insights on your market and competitors. It allows you to instantly generate dynamic visualizations from filtered intelligence datasets, all grounded on business tags powered by GenAI with unprecedented accuracy.
Unlike traditional ML models, GenAI-based tagging infrastructure understands context, meaning, and sentiments from text present in datasets, and accurately categorizes them.
With One-Click Trend Analysis, you can:
- Turn intelligence datasets into dynamic charts, graphs, timelines, and more in seconds.
- Enable your team to unlock visual insights with an intuitive self-serve interface, removing their reliance on others.
- Include trend analysis charts in your newsletters, dashboards, and presentations.
- Identify market shifts, competitor activities, and emerging opportunities with a single click.
What this means is that you don’t have to wrangle on spreadsheets manually, juggle with complex BI tools, or rely on specialized teams to get snapshots that quickly outdate.
Now you can spot and act on what’s changing in your market landscape before your competitors notice it.
How it helps: effortlessly visualize, discover, and share trends
Let’s take a deeper look at how Contify One-Click Trend Analysis helps you facilitate faster, data-backed strategic decisions and tactical responses.
1. Generate intuitive intelligence visualizations in seconds
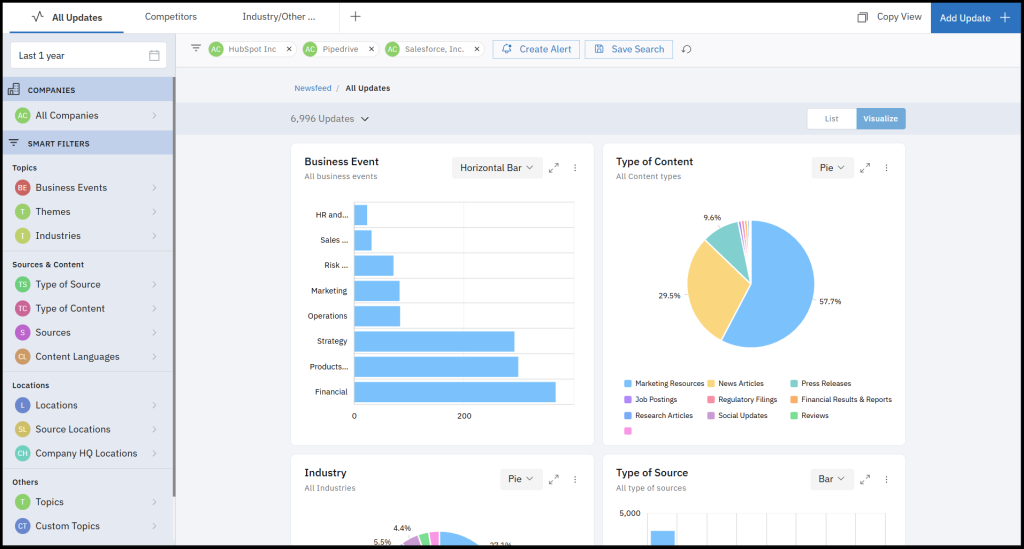
Contify platform features rich, structured intelligence datasets covering public and private companies, industries, and topics from global sources. Every piece of incoming data is automatically and accurately categorized by a GenAI-powered tagging engine, which applies a comprehensive business taxonomy from 100+ relevant tags, spanning Business Events, Strategic Themes, Industries, Source Types, Languages, and more.
With precisely tagged datasets at your fingertips, you can effortlessly filter them to zero in on the exact data you need to generate visualizations.
Then, simply clicking the ‘Visualize’ mode will instantly transform this dataset into dynamic charts, graphs, timelines, or topic clouds to surface macro-level trend insights on your market and competitors.
No more exporting to spreadsheets, figuring out BI tools, or relying on specialized teams to help.
2. Uncover market shifts, competitor activities, and emerging opportunities
By transforming your filtered intelligence datasets into dynamic visuals, you’re well equipped to spot the patterns and trends that signal change.
Whether it’s a competitor increasing their messaging around a specific topic, new companies gaining traction in a particular industry, or a surge in business activities like M&A or partnerships within your target market, these insights become immediately apparent.
One-Click Trend Analysis helps you move beyond isolated news updates and see the bigger picture across their market landscape. It lets you instantly spot changes in competitor activities, early market shifts, and emerging opportunities.
You get clear, visual insights to make timely, confident decisions. Moreover, your business teams can independently surface trend insights, allowing you to focus on deeper strategic work.
3. Effortlessly share trend insights with your teams
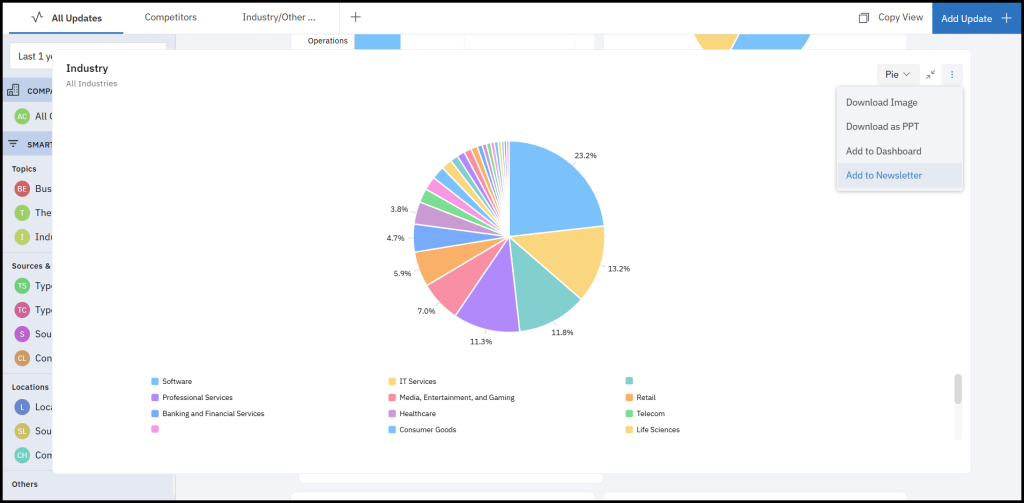
Once you’ve generated visualizations, you can easily embed them into your Contify dashboards and intelligence newsletters or export them as a PPT slide or an image for offline discussions and presentations.
This gives you a straightforward way to keep intelligence deliverables current and easily accessible to all stakeholders, ensuring everyone has the most up-to-date information.
Furthermore, unlike static decks or reports, visual dashboards in Contify are dynamic and auto-updated. Stakeholders not only see the latest trends, but they can also click through to dive deep into the underlying datasets to understand the developments resulting in the trend.
This fosters a more interactive and engaged approach to intelligence consumption across the organization, leading to better-aligned strategies and faster, more informed collective action.
Real-world use cases: One-Click Trend Analysis in action
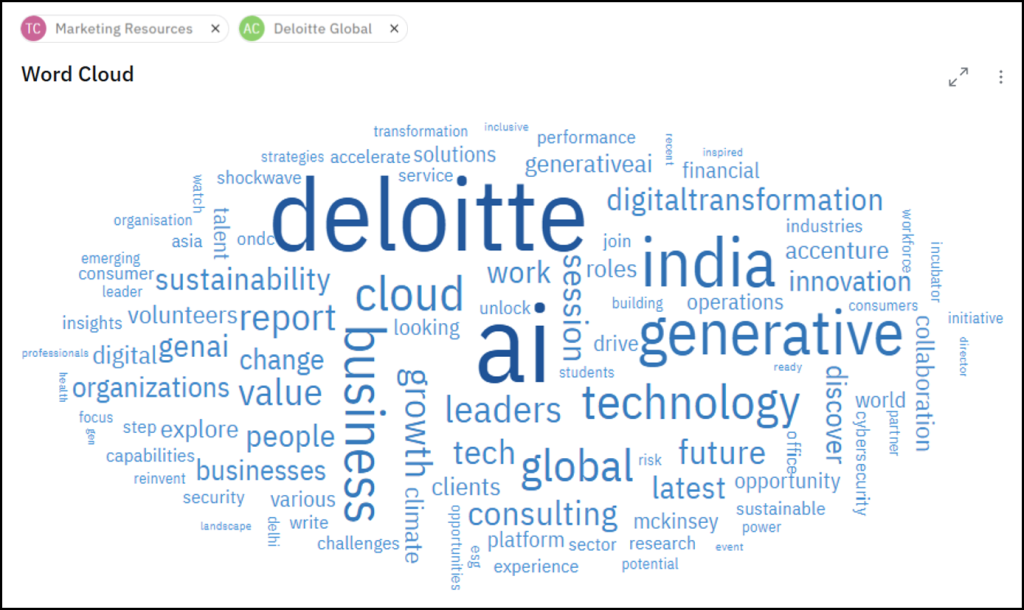
1. Identify key content focus themes of competitors
|
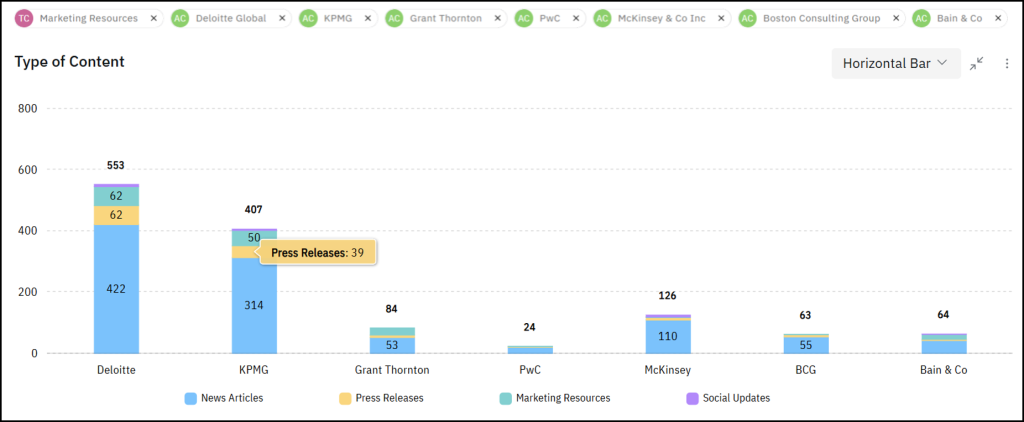
2. Analyze the share of content types in competitors’ content strategies
|
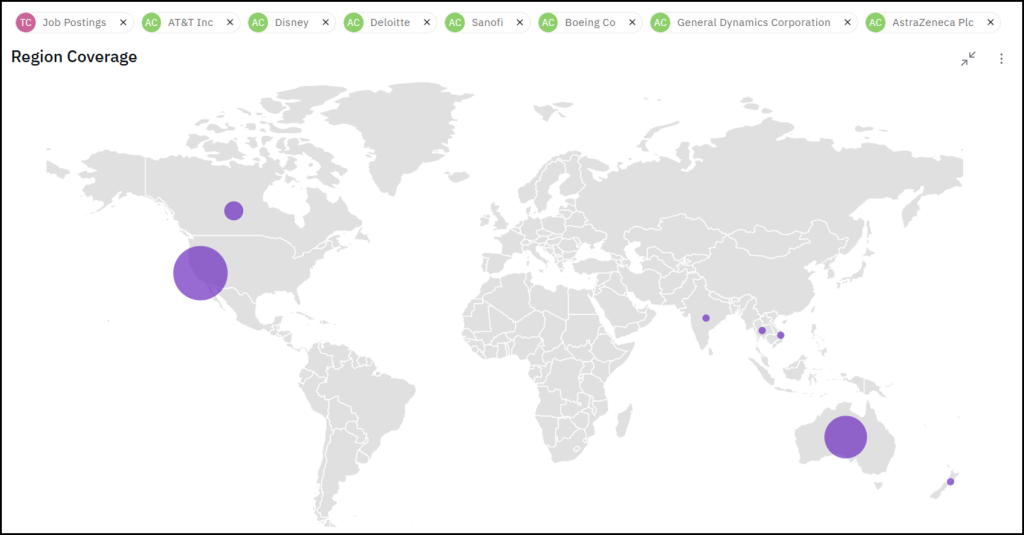
3. Identify which geographic areas competitors are focusing most on for key hirings
|
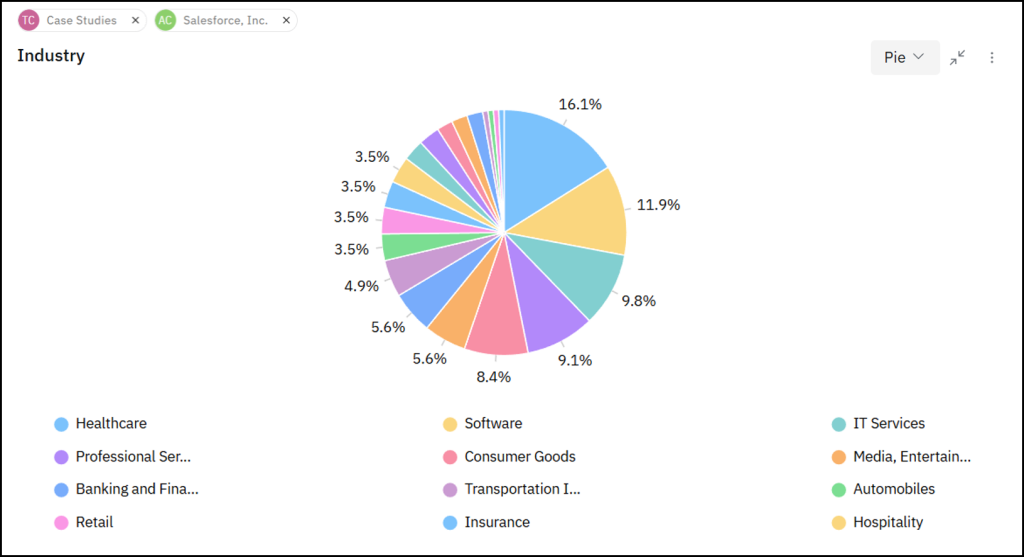
4. Know which geographic areas or industries competitors are focusing most on for business expansion
|
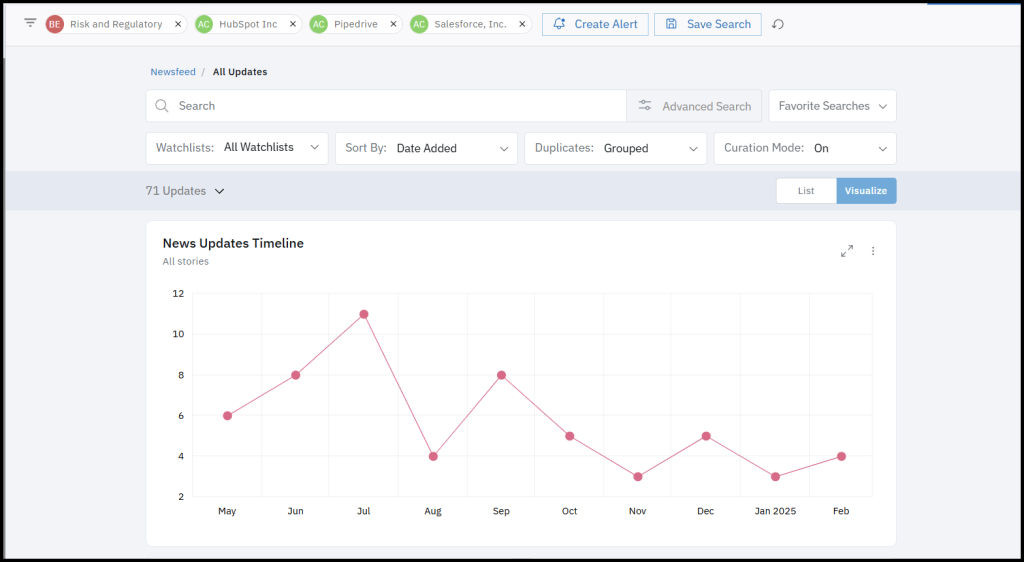
5. Detect early distress signals in monitored industry, competitors, partners, customers, or suppliers
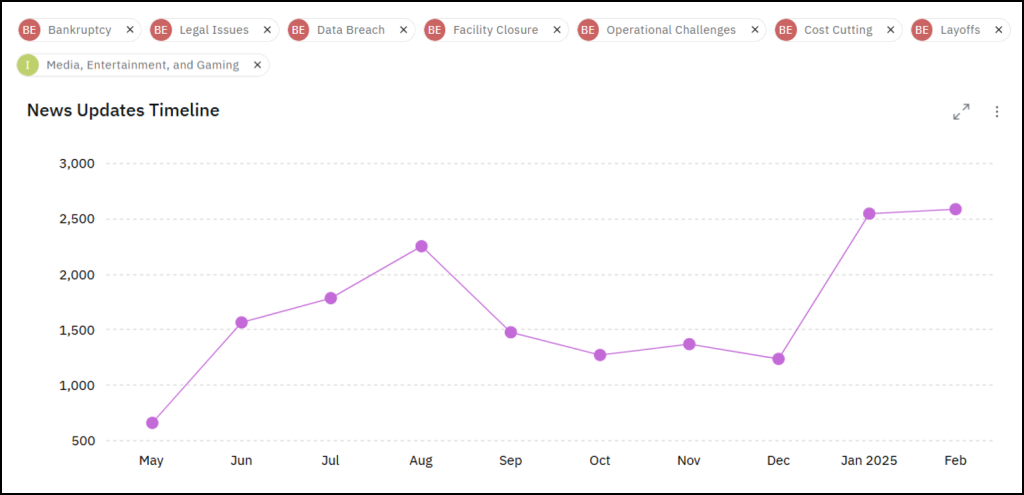
|
6. Know key business event trends in the monitored industry or competitors
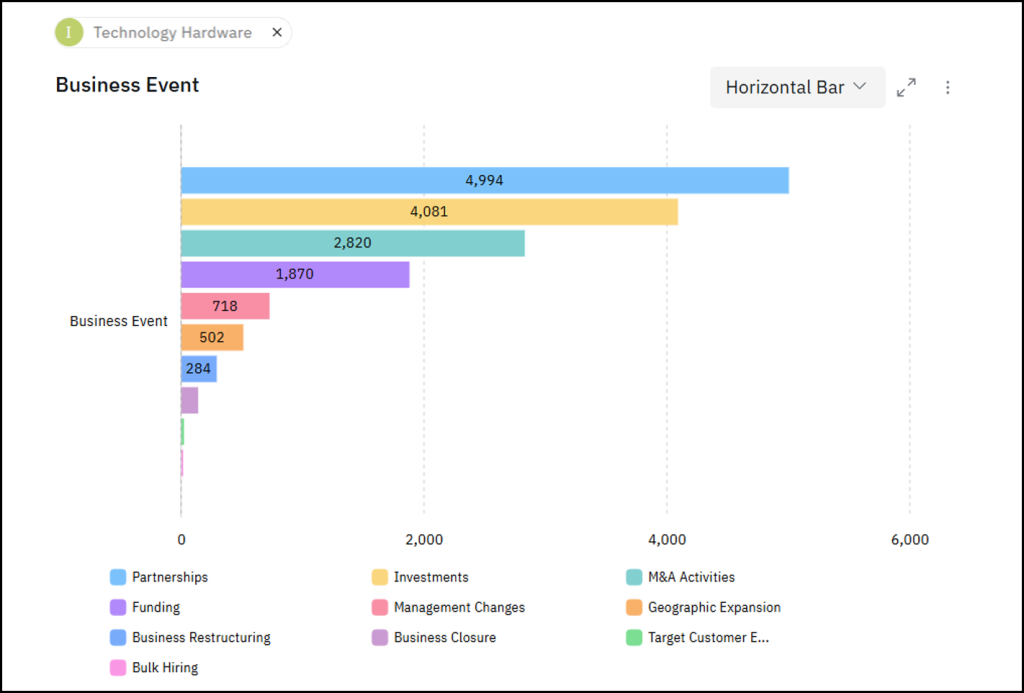
|
7. Identify trending companies in monitored industries or overarching business themes
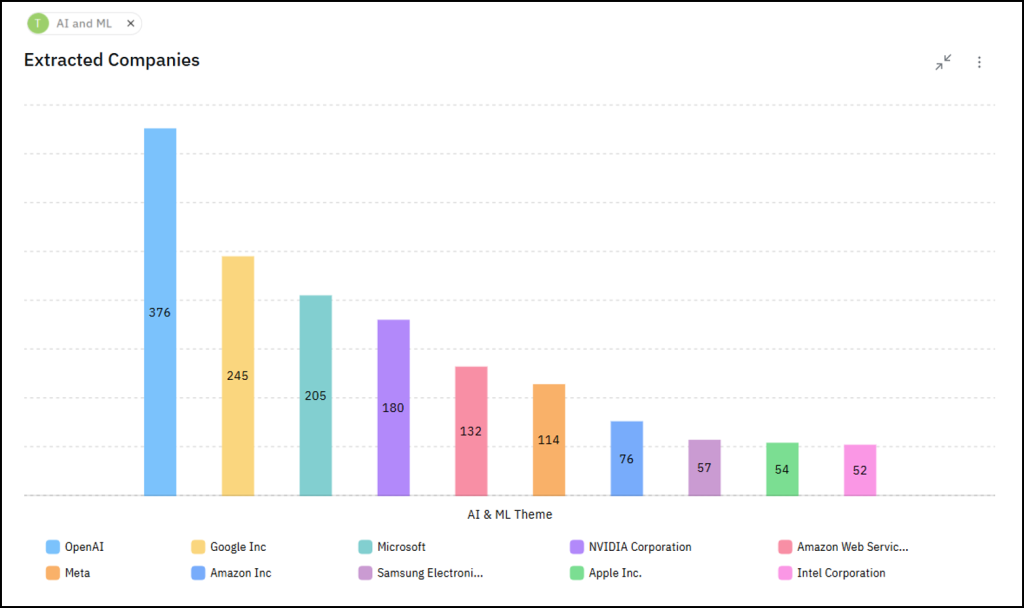
|
And many more…
Beyond basic visualization: purpose-built for surfacing M&CI trends at scale
While many tools offer some form of data visualization, Contify’s One-Click Trend Analysis is specifically designed for the complexities and nuances of market and competitive intelligence, and visualizations are highly accurate because of the GenAI-powered tagging engine.
It moves beyond the limitations of:
- Manual methods (Excel/PowerPoint): These are time-consuming, error-prone, and result in static, quickly outdated snapshots.
- Basic newsfeed reviews: The volume of information present makes pattern recognition difficult and subjective.
- Business intelligence tools: These require considerable technical skills and aren’t specifically designed for unstructured intelligence datasets.
- Media monitoring tools: These tools don’t have extensive coverage of the information from company websites, PR/News sites, regulators, and more, or may require separate workflows to connect trends.
- Trend discovery tools not built for M&CI: Tools like Trendtracker, Exploding Topics, surface broad, generic trends, and lack contextual relevance to specific companies or business topics being monitored.
- Other market and competitive intelligence tools: Limited to basic trend visuals, limited content coverage, and disconnected from other intelligence workflows.
Contify’s advantage lies in its foundation of AI-powered tagging that ensures accuracy and a rich, structured intelligence database. This means the trends you see are not just superficial keyword counts but are grounded in a deep understanding of companies, industries, and business events, providing more meaningful and actionable insights.
Gain the advantage of visual trend insights
By utilizing One-Click Trend Analysis capabilities, you can democratize visualization capabilities across your entire team and ultimately create an insight-driven culture where emerging trends are identified early, understood clearly, and acted upon decisively.
See Contify One-Click Trend Analysis in action—schedule a demo now.


