Improved Dashboards enable organizations to better leverage Market Intelligence for efficient competitive landscape analysis.
T he dashboard has been a core component of our Market Intelligence offering. It has enabled our users to surface high-level trends and enable competitive landscape analysis. However, over the last year, we have worked closely with our customers to learn their challenges around delivering Market Intelligence output to internal and external stakeholders. What we’ve learned is that teams encounter issues around organizing reports, doing efficient competitive market analysis, and keeping version control. What’s even more surprising is that analysts spend over 40% of their time on formatting decks when most of their time should be invested in analyzing data and drawing the required market and competitive insights. To address these challenges, we have launched the new and improved dashboards with the following features:
1. Ability to create multiple dashboards
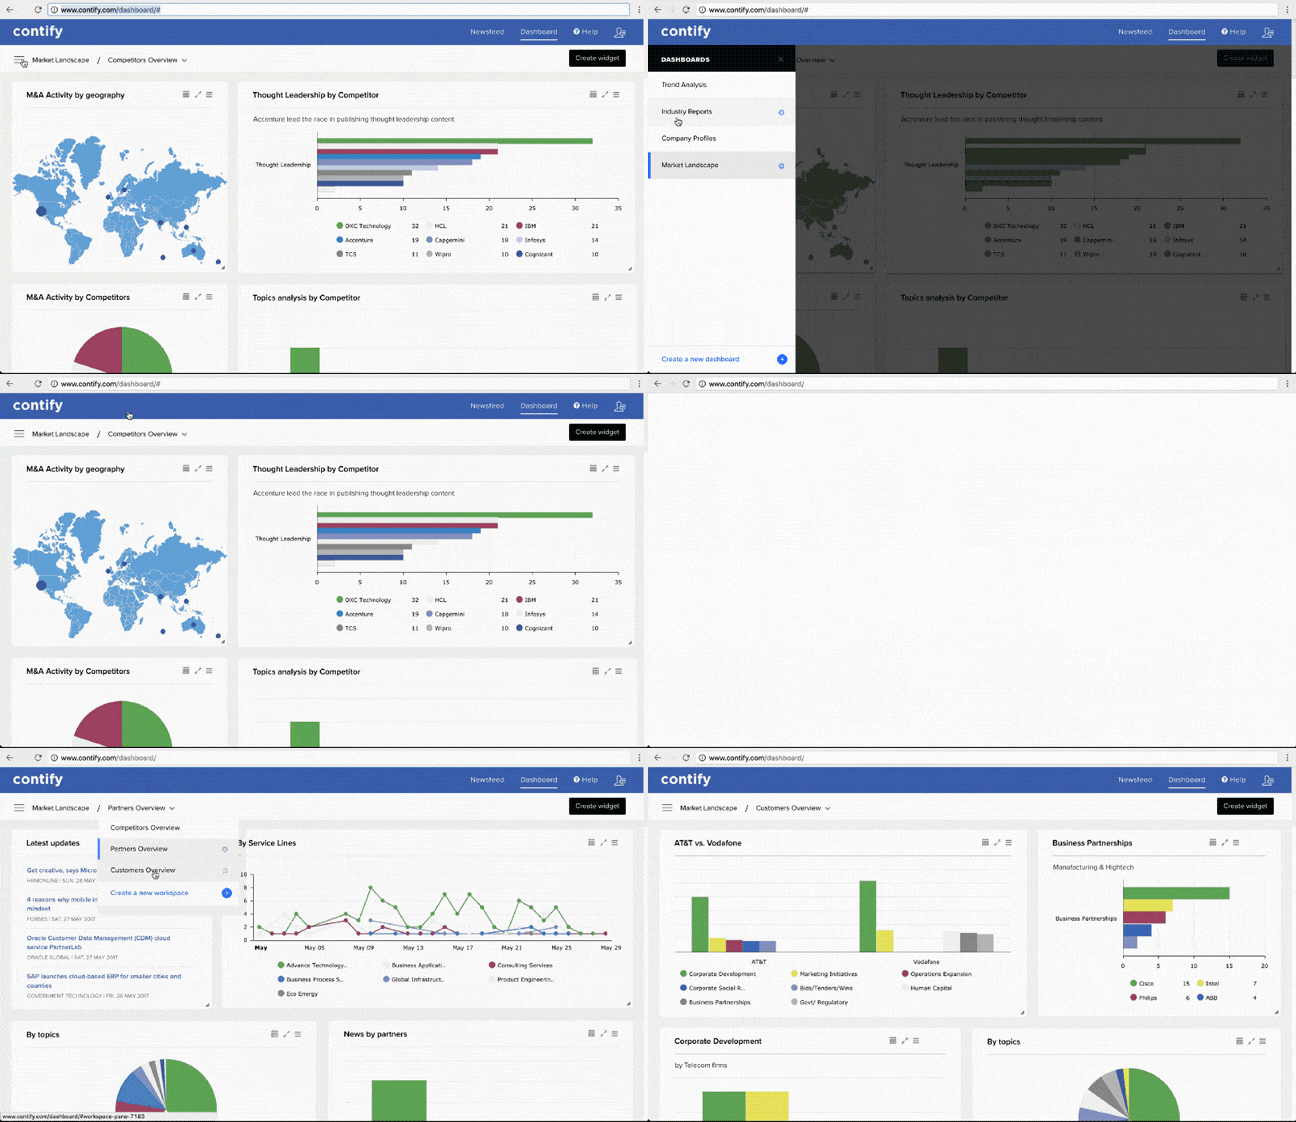
Earlier, users could only create workspaces which they could populate with charts. This resulted in too many workspaces and no way to organize them. Now you can create as many dashboards as required. For example, you could create a dashboard for company profiles and populate them with profiles of all the companies that you are tracking. Similarly, you could create a dashboard for Industry reports and populate them with analysis of different industries that you are reporting on.

2. Create and update data widgets
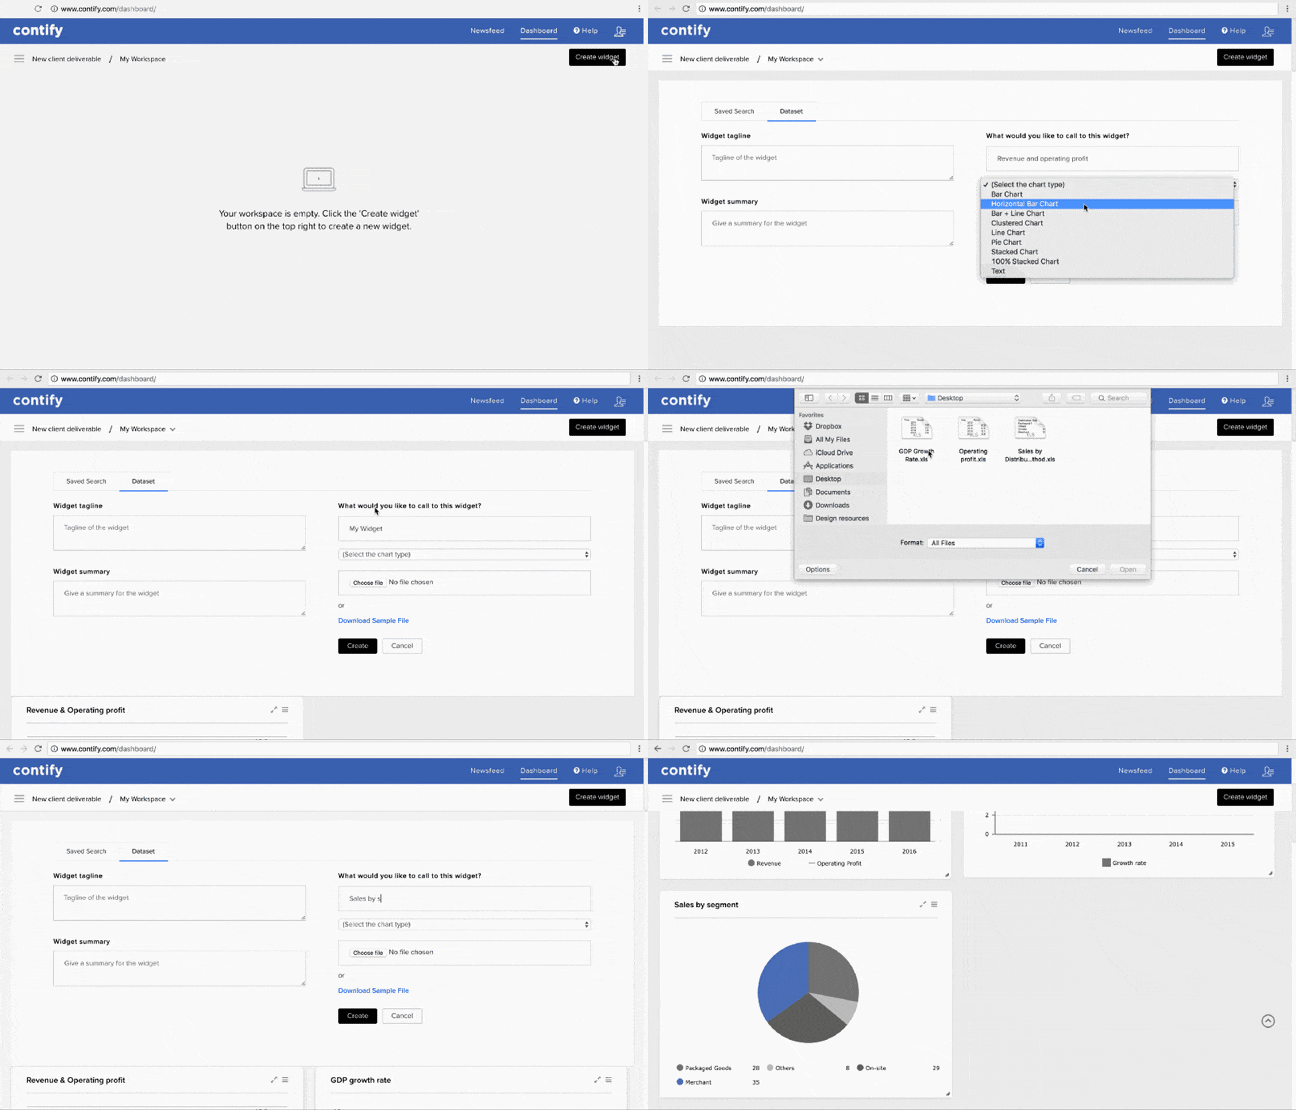
Data widgets allow you to generate charts and graphs by uploading a spreadsheet. These charts can be edited from within the dashboards. You no longer need to keep version control and whatever updates you make will be live in the dashboard and can be instantly shared with stakeholders.

3. Extensive charting library
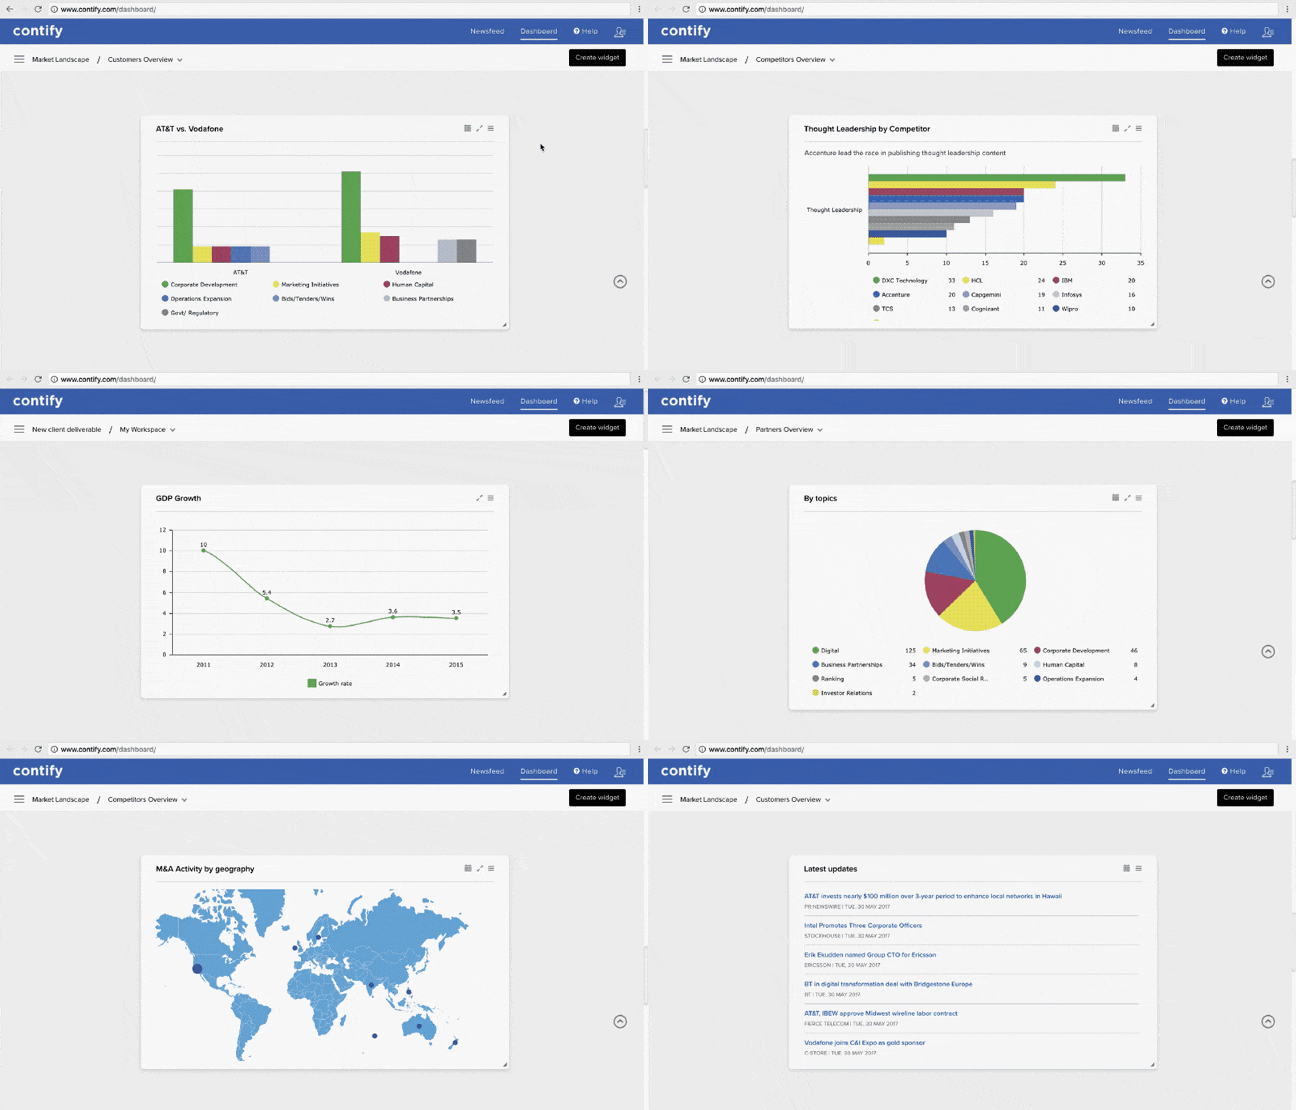
Our dashboards now support over 10 pre-formatted chart types including bar chart, horizontal bar chart, bar+line chart, pie chart, stacked chart, and 100% stacked chart. We will soon be adding a bubble chart, mekko chart, and scatter chart to our library. Any chart that you create in the dashboard is beautiful and presentation-ready. You don’t have to spend any time on formatting and making things look good.

We are hopeful that the new dashboards will enable you to spend more time in competitive analysis of the data and drawing market & competitive insights while we take care of your secondary research requirements that save your time.


